
By Chris Rylands, Principal, Wealth Advisory
Market Returns
Reporting date 31 October 2016
|
INDEX |
1MTH |
3MTH |
6MTH |
1YR |
3YR |
5YR |
| AUSTRALIAN EQUITIES | ||||||
| S&P/ASX 200 TR Index AUD |
-2.15 |
-3.2 |
3.46 |
6.11 |
3.87 |
9.17 |
| S&P/ASX Small Ordinaries TR Index AUD |
-4.72 |
-4.77 |
6.2 |
14.9 |
4.42 |
2.69 |
|
|
|
|
|
|
||
| GLOBAL EQUITIES | ||||||
| MSCI World ex Australia NR Index AUD | -1.38 |
-1.42 |
2.52 |
-5.4 |
11.94 |
16.78 |
| MSCI Emerging Markets NR Index AUD |
0.8 |
3.93 |
9.73 |
2.45 |
5.36 |
7.46 |
| FIXED INTEREST | ||||||
| Bloomberg Ausbond Composite 0YR Index AUD |
-1.28 |
-1.08 |
2.23 |
4.03 |
5.77 |
5.82 |
| BarCap Global Aggregate TR Index (AUD Hedged) |
-0.90 |
-0.78 |
2.47 |
6.71 |
6.63 |
6.76 |
| EXCHANGE RATE | ||||||
| AUD/USD Spot Rate | -0.72 | 0.17 | 0.08 | 6.6 | -6.99 | -6.29 |
Source: Bloomberg
Market Update
Cash
At its August 2nd meeting, the Reserve Bank of Australia (RBA) decided to lower the cash rate by 0.25% to 1.50%, marking yet another record low. Since it began its cutting cycle in November 2011, the RBA has brought the cash rate down from 4.75%, and has kept it below 3.00% for 38 consecutive months.
The cash rate was left unchanged at 1.50% at the September meeting. While economic growth remains ok, the Consumer Price Index (CPI) / Inflation figure for the June quarter recorded an annual increase of only 1.0%. This reading was below the 2% target rate and reinforced the RBA’s concerns about weak price growth following the March quarter figure of 1.3%. September’s rate decision was the last with Glenn Stevens at the helm, with incoming Governor Philip Lowe to taking over as of 18th September.

Source: Reserve Bank of Australia
The RBA again decided to leave interest rates unchanged on October 4th, with markets effectively pricing no chance of a cut. On the housing front, the RBA appeared relatively relaxed, noting the slowdown in lending growth and turnover, as well as the new supply of apartments coming online which is expected to slow prices and rents.
The RBA was again unmoved at its November meeting, once again leaving the cash rate unchanged at 1.50%. Financial markets had all but priced out the chance of a cut, anticipating that the board would hold tight following its two cuts in May and August.
The highest term deposit rates we currently have available are 2.65% across 3 months, 3.00% across 6 months and 3.00% for 12 months.
Fixed Income
Global bonds, as measured by the Barclays Global Aggregate TR Index, returned 0.05% in August as yields remain at low levels throughout the world. Australian bonds, measured by the Bloomberg Ausbond Composite 0+ Year Index, returned 0.42% in August.
In September, global bonds returned 0.07%, with long-term yields easing from their mid-month highs. Early in the month, investors might have had every reason to anticipate a United States rate hike after comments by the Federal Reserve (Fed). Come 21st September, there were enough excuses to remain on hold, although the Fed’s statement reiterated that the case for a hike had strengthened. Australian government bonds returned -0.31% in September as the 10- year yield pushed higher from 1.82% to 1.91%, hitting a mid-month high of 2.17%.
Global bonds, returned -0.90% in October in Australian dollar ($A) terms. Yields had begun to climb from their record lows, prompting investors to ask if the turning point in historically low bond yields had finally arrived. Australian bonds returned -1.28% in October as the 10-year yield broke out from 1.91% to 2.35%.
Australian Equities
The Australian market took an early stumble in August following the RBA’s rate cut; with investors concerned about what message low rates were saying about the health of the economy. The S&P/ASX 200 Index was down -2.18% following the announcement, before sliding further late in the month to finish at 5415 points. Returns on Australian shares were -1.55% in August, taking the 12-month return to 9.30%. Small cap shares were -1.56% in August, in line with large cap results, with returns over 12 months reaching 26.55%.
The Australian market continued its slide into the start of September, before recovering strongly in the second half of the month. Returns on Australian shares were a modest 0.48%, supported by large gains in mining shares, as well as the OPEC oil deal, which had a significant impact on energy market sentiment. Smalls cap shares were 1.53% higher during the month.
The Australian market sold off in October in anticipation of the upcoming US election uncertainty. The S&P/ASX 200 followed US markets down, with the index ending the month at 5229. All sectors suffered, with the exception of materials, which was able to add to large gains over the past five months. Small caps returned -4.72% in October, underperforming large cap shares, with the 12- month return moving down to 14.90%.
International Equities
Global equities were generally calm in August, providing investors with the opportunity to pause for breath in the lead up to the US election. Equity indices were mostly flat as investors took time to assess the economic situation and to await guidance from central banks. Global shares, measured by the MSCI World TR Index (AUD), returned 1.27%, which was matched by the US market.
Global indices were down in September as volatility made a brief comeback, driven by monetary policy uncertainty. Global shares returned -1.22% whilst the US S&P 500 Index returned -1.77%. Market reaction to the first debate between presidential nominees Hillary Clinton and Donald Trump saw the former come out on top. Financial markets remained nervous about the possibility of a Trump presidency.
Global shares were also down in October, with a gradual sell-off in the US placing renewed pressure on European markets. The US election also replaced Brexit as the geopolitical event to watch. Despite the media frenzy, markets were remarkably stable in October, however this would soon change in the lead up to Election Day.
Alternatives – Hedge Fund strategies
Hedge Fund strategies tracked sideways over the September Quarter. Hedge Fund strategies are included in a portfolio for diversification and for the traditionally low correlation to other asset classes, particularly shares. It was no surprise to see these strategies post somewhat mixed results in September amongst a choppy quarter for global share markets. Over the September quarter, a basket of diversified hedge fund strategies provided a return of 2.4%, with indicative performance for October of 0.62%.
Asset Class - Update Commercial Property | Part 3
The current commercial property cycle is now over eight years old. This means the risk of a reversal or extended period of consolidation continues to grow. The Reserve Bank of Australia (RBA) voiced concerns earlier this year that many commercial property values appeared unsustainable over the medium to long term. However, values are likely to remain supported in the near term as investors continue to demand income in an environment of historically low interest rates.
Caution is now required at this point in the cycle despite the cushion provided by low interest rates. Reviewing the chart below from Part 1 confirms that the bulk of the capital gains are now in the past and the “easy money” has been made. Commercial property yields are now approaching the lows (property values approaching the highs) reached immediately prior to the Global Financial Crisis.
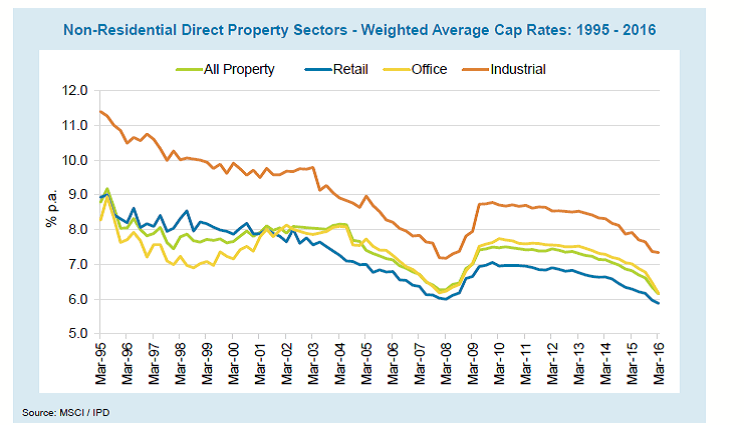
Source: Folkestone
An added reason for caution is the sector’s illiquidity. As discussed in Part 2 of our update, selling a commercial property generally takes three to six months and may take longer in a market downturn. The lack of liquidity in the property markets means an investor is unable to readily react to changing market conditions by selling a property.
This also means that the property may have to be held through a market downturn and even sold if there is a breach of banking loan covenants. This locks in a loss at the worst possible time. The loss will be magnified to the extent that there is gearing on the property.
What could make the market turn?
- A sustained rise in United States (US) bond yields. The yield on long duration income producing assets like property and infrastructure are generally compared to the global cost of money: the US 10 year bond yield. When the yield on the US 10 year bond increases, other income producing assets become less attractive. We have seen domestic listed property, infrastructure and utilities stocks suffer sharp declines over the last quarter as global bond yields increased. The chart below shows the performance of the Australian Real Estate Investment Trusts so far this year.
- Debt will also become relatively more expensive if the US 10 year bond yield increases. Australian banks often seek funding in international markets and higher borrowing costs will need to be passed on to domestic borrowers. Higher inflation expectations could cause global bond yields to jump higher. The yield on the US 10 year bond went from 1.78% – 2.14% post-election on the basis that Trump’s fiscal stimulus would cause US inflation to rise.
- Slower economic growth. Australian economic growth is largely hostage to international events. A slowdown in the global economy, particularly in China, would have ramifications for domestic economic growth and trade. This would reduce demand by businesses for commercial space. Trump’s victory is likely to increase political tension between the US and China, which could have unintended consequences for domestic growth.
- A fall in international real estate. A change in the value of global real estate can cause investors to reassess the value of domestic property. “Brexit” was an example where listed real estate in the United Kingdom (“UK”) was repriced to reflect changes in the UK economy. The repricing in the sector also caused a revaluation of global listed real estate outside the UK, even though the actual properties had little or no links to the region.
Asset Allocation and Portfolio Construction
Commercial property can play an important role in an investment portfolio. It can provide regular income and lower overall portfolio volatility given the asset class is unlisted. Depending on a client’s risk profile, an allocation of 10 – 15% can add value through an investment cycle. However, given current valuations, illiquidity and the potential for higher bond yields we are progressively existing the sector rather than adding additional exposure to client portfolios at this time.
Outlook
Much remains unclear post the election result. Trump already appears to have moderated his view on certain issues and it is difficult to determine which of these will become a political reality. It is clear that the US will now become more focused on domestic issues rather than global issues.
The main elements of Trump’s campaign included greater fiscal stimulus, infrastructure spending and capturing a greater share of global trade. The final objective is likely to increase tensions with China, which could lead to the US to placing tariffs and taxes on Chinese goods to make its own goods more competitive. The overall impact of these tensions on global economic growth remains unclear.
Financial markets have reacted more positively after the initial shock, as investors embraced the potential for higher US economic growth under a Trump presidency. The chart below shows the sharp selloff and subsequent rally.

Investors were particularly enthusiastic about a return to fiscal stimulus given the commonly held view that low interest rates are now having limited impact.
Global bond yields have also jumped in response to the prospect of higher inflation from US fiscal stimulus. Higher US bond yields has seen the US dollar appreciate against all major currencies. A higher US dollar could relieve pressure on the Australian dollar thereby reducing the RBA’s incentive to cut the cash rate again. Unhedged exposure to international equities would also benefit from a declining currency.
Domestically resource stocks are seen as beneficiaries of increased demand for coal and iron ore from Trump’s energy and infrastructure policies, as are construction companies with exposure to US activity. Infrastructure, utility and property stocks are seen as underperformers because of the risk of higher bond yields.
It is far too early to know for certain how all these forces will play out and what the impact on global markets will be. We will provide a further update on the implications of Trump’s presidency in our first Private Wealth View in 2017.
We will continue to monitor events in the US for potential impact on client portfolios, with volatility expected to remain above average until further clarity on Trump’s policies is provided. We will provide another update if an adverse event occurs that will materially impact financial markets.